Evaluation Metrics Interview FAQ
Choose the right metric for your problem
Understanding evaluation metrics is critical for any ML interview. Choosing the wrong metric can lead to models that perform well on paper but fail in production.
Quick Navigation
| Section | Topics Covered | Difficulty |
|---|---|---|
| Classification Metrics | Accuracy, Precision, Recall, F1, AUC | Fundamental |
| Precision vs Recall | When to prioritize which metric | Intermediate |
| ROC vs PR Curves | Curve comparison and interpretation | Intermediate |
| Regression Metrics | MSE, RMSE, MAE, R-squared, MAPE | Fundamental |
| MAE vs RMSE | When to use which error metric | Intermediate |
| Ranking Metrics | NDCG, MAP, MRR | Advanced |
| Imbalanced Data | Handling class imbalance | Intermediate |
| Micro vs Macro Averaging | Multi-class metric aggregation | Intermediate |
| Calibration | Probability calibration metrics | Advanced |
Classification Metrics
Q1: What is accuracy and when should you NOT use it?
Accuracy = (TP + TN) / Total
When NOT to use:
- Imbalanced datasets: 99% negative class means "always negative" gets 99% accuracy
- Different error costs: Missing cancer (FN) vs false alarm (FP)
- Rare event detection: Fraud, anomalies, rare diseases
Q2: Explain Precision and Recall with examples.
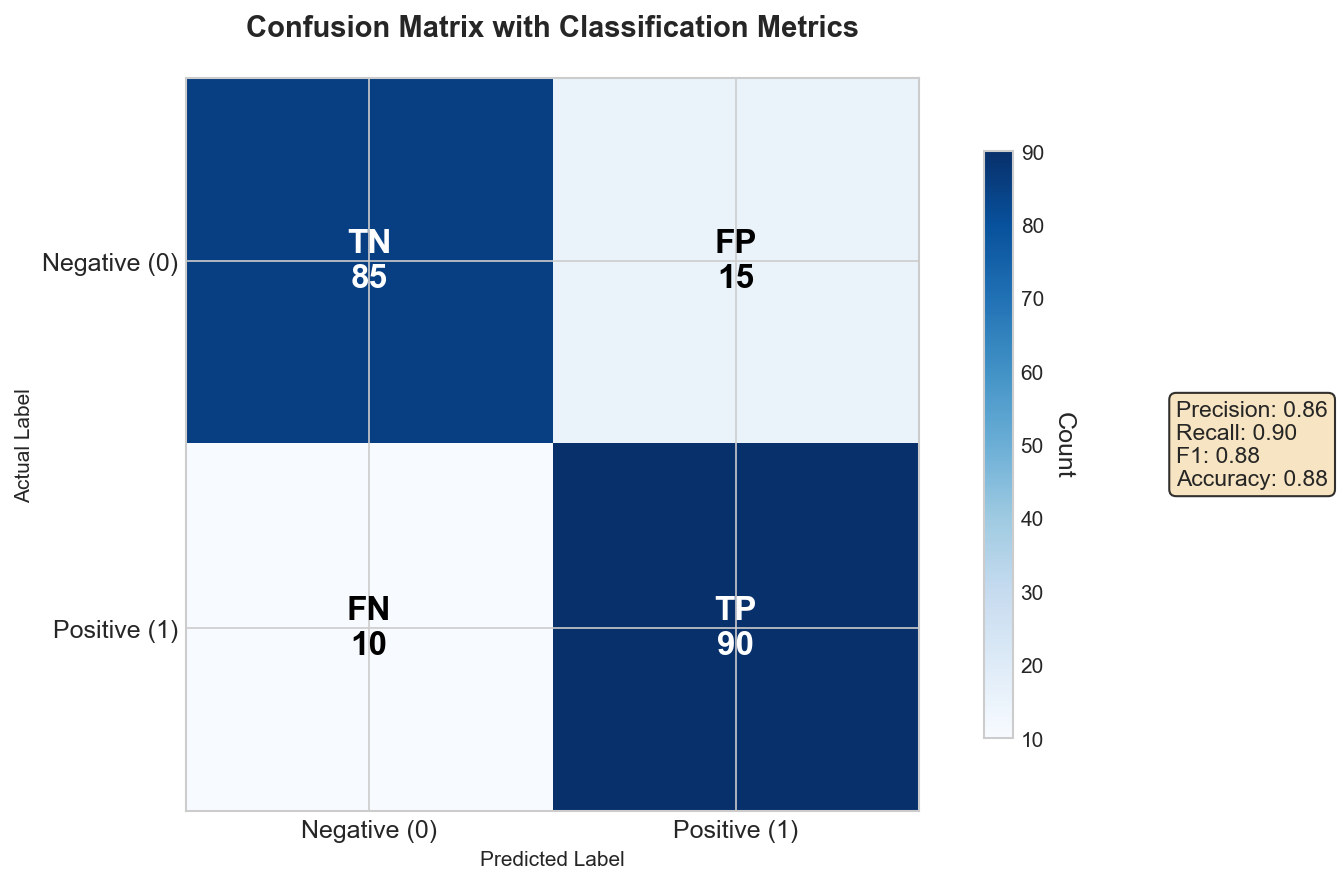
Precision = TP / (TP + FP) - "When I predict positive, am I right?"
Recall = TP / (TP + FN) - "Did I find all the positives?"
| Metric | Example |
|---|---|
| Precision | 90 of 100 flagged spam emails were actually spam = 90% |
| Recall | Caught 80 of 100 actual spam emails = 80% |
Q3: What is the F1 Score and why use it?
F1 Score is the harmonic mean of precision and recall:
Why harmonic mean? It penalizes extreme imbalances:
| Precision | Recall | Arithmetic Mean | F1 (Harmonic) |
|---|---|---|---|
| 1.0 | 0.0 | 0.5 | 0.0 |
| 0.9 | 0.1 | 0.5 | 0.18 |
| 0.7 | 0.7 | 0.7 | 0.7 |
F-beta Score: Generalizes F1 with configurable weighting:
- F0.5: Weights precision higher (FP cost > FN)
- F2: Weights recall higher (FN cost > FP)
Q4: What is AUC-ROC and how do you interpret it?
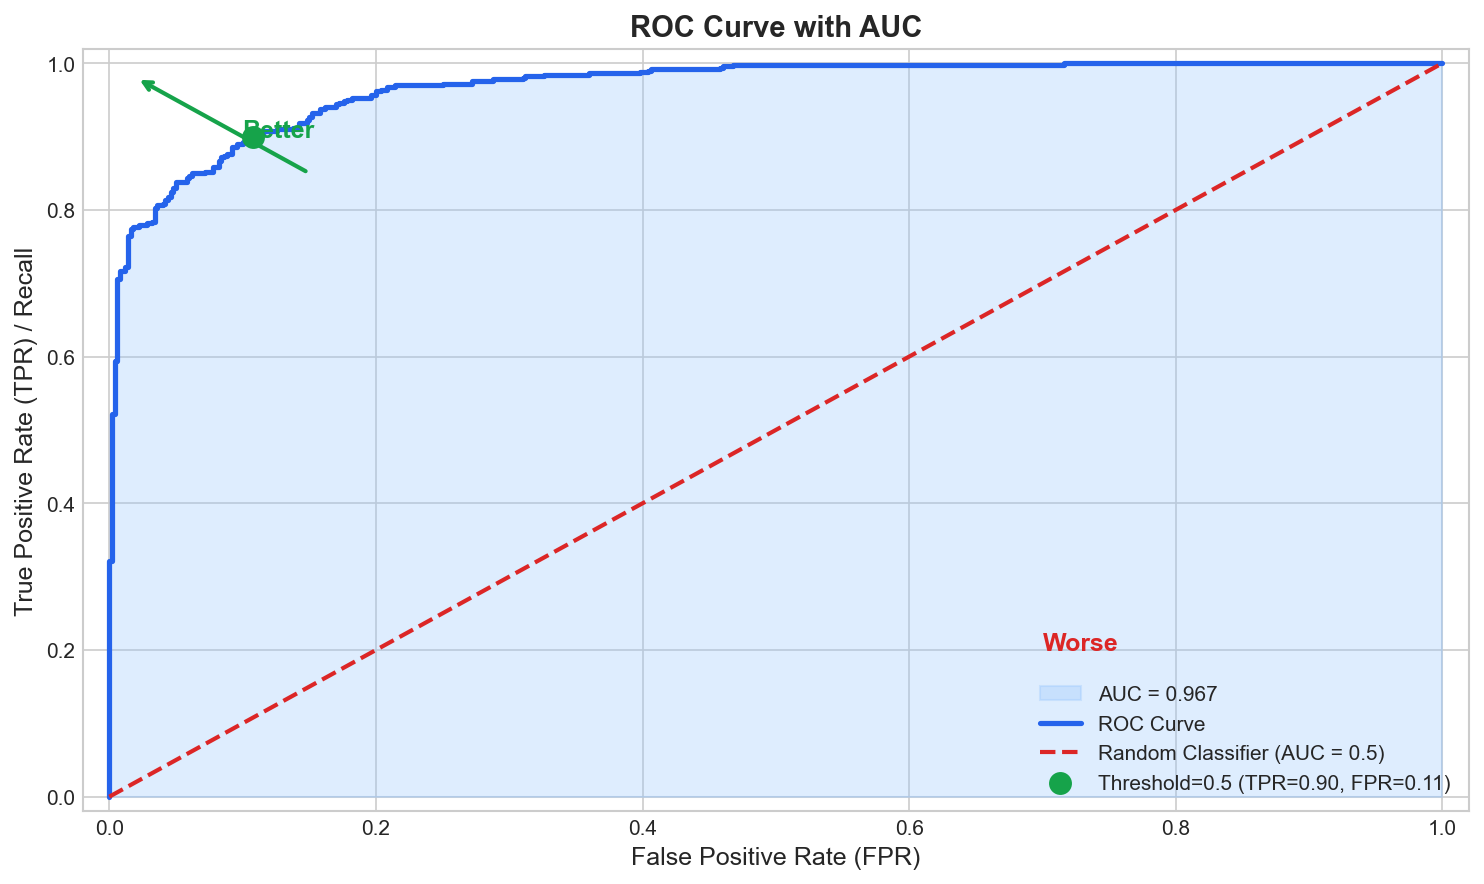
ROC Curve plots TPR (Recall) vs FPR at all thresholds. AUC-ROC = Area Under Curve.
| AUC Value | Meaning |
|---|---|
| 0.5 | Random guessing |
| 0.7-0.8 | Acceptable |
| 0.8-0.9 | Good |
| 0.9+ | Excellent |
Probabilistic Interpretation: AUC = P(random positive scored higher than random negative)
Q5: What is AUC-PR and when should you use it?
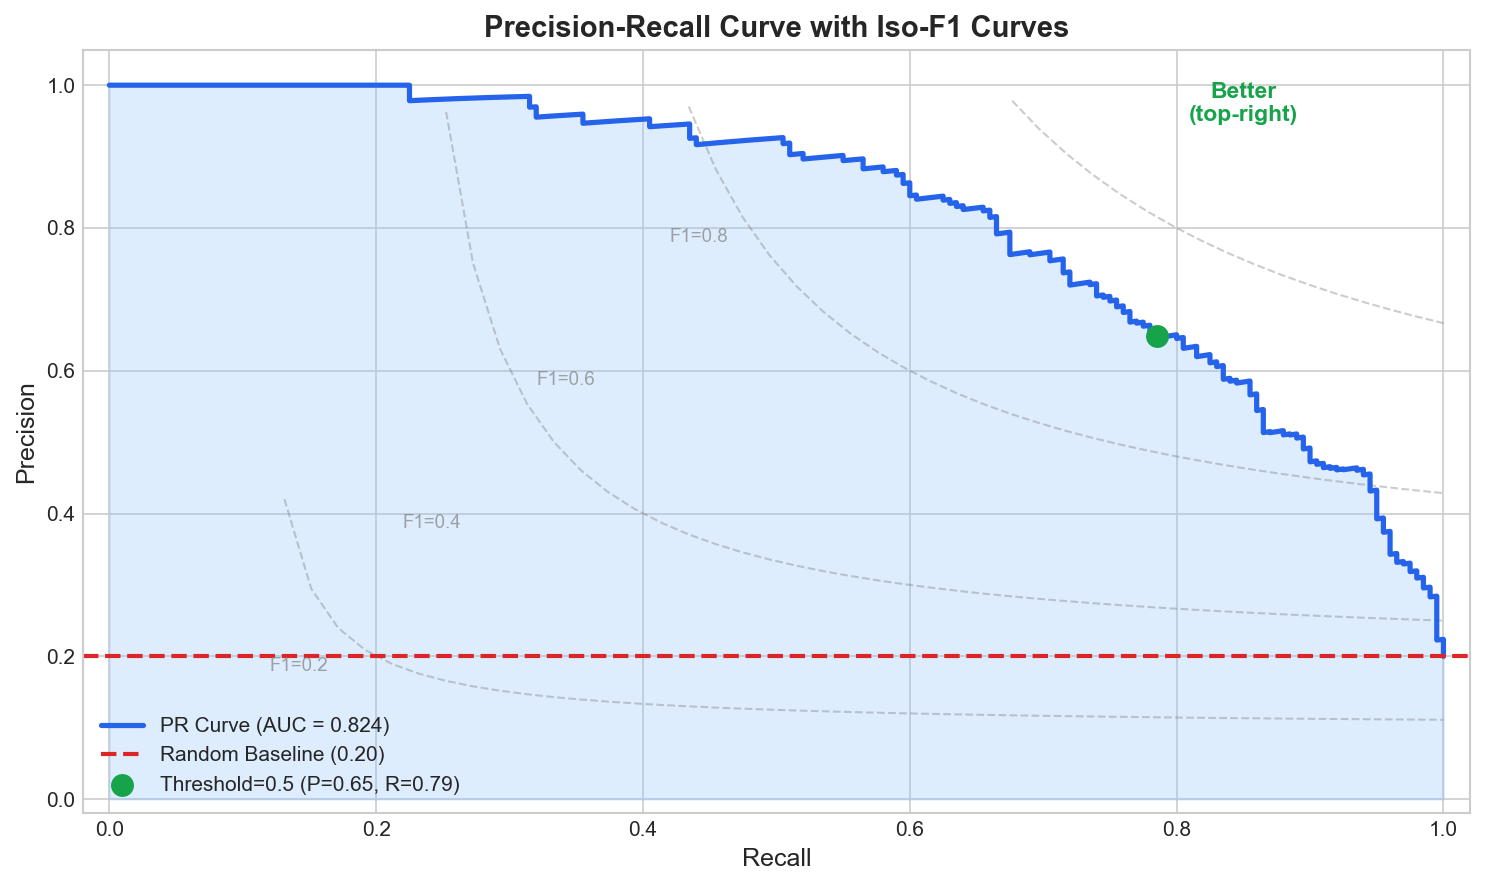
PR Curve plots Precision vs Recall. The iso-F1 curves show constant F1 score contours.
| Aspect | ROC Curve | PR Curve |
|---|---|---|
| Uses TN | Yes (in FPR) | No |
| Class imbalance | Less sensitive | Directly reflects it |
| Baseline | Diagonal (0.5) | Positive class % |
| Best for | Balanced | Imbalanced |
Rule: Use PR-AUC when positive class is rare.
Q6: What is Log Loss?
Log Loss (Cross-Entropy) measures quality of predicted probabilities:
Key Properties:
- Range: 0 to infinity (lower is better)
- Penalizes confident wrong predictions severely
- Requires probability outputs (not just hard labels)
Use when: Confidence of predictions matters, not just correctness.
Precision vs Recall Deep Dive
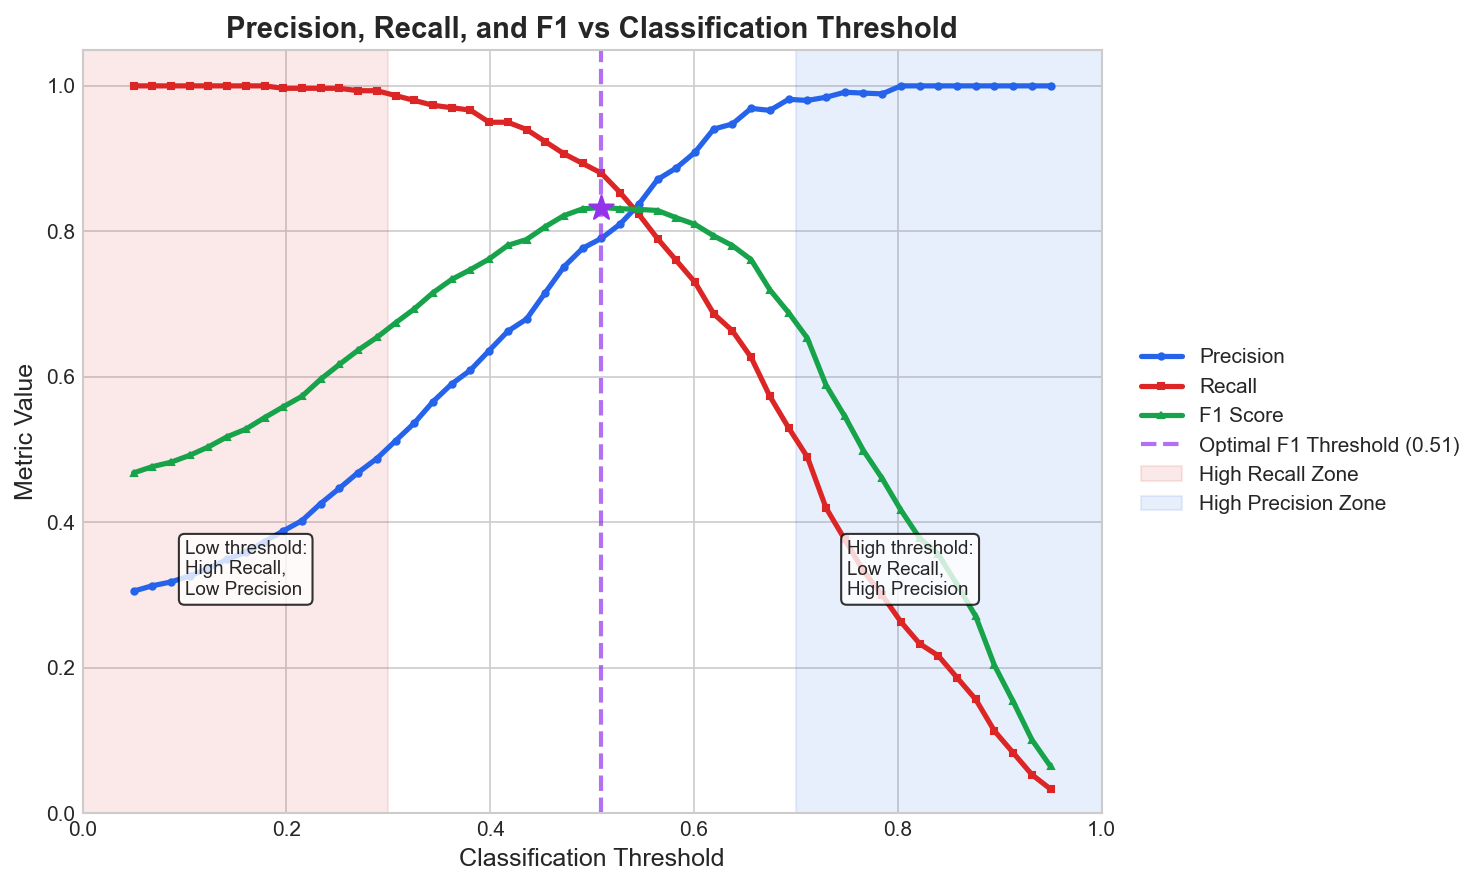
The visualization above shows how precision, recall, and F1 change with classification threshold.
Q7: When should you prioritize Precision?
Prioritize Precision when FP costly: Spam filtering, drug recommendations, automated blocking, alert systems.
Q8: When should you prioritize Recall?
Prioritize Recall when FN costly: Cancer screening, fraud detection, security threats, manufacturing defects.
Q9: How do you choose in practice?
- Quantify error costs with stakeholders
- Calculate cost ratio: Cost(FN) / Cost(FP)
- Choose threshold from the metrics curve above
| Cost Ratio | Strategy |
|---|---|
| FN >> FP | Low threshold (high recall zone) |
| FP >> FN | High threshold (high precision zone) |
| FN = FP | Optimal F1 threshold |
ROC vs Precision-Recall Curves
Q10: Compare ROC and PR curves.
See the ROC and PR curve visualizations in Q4 and Q5 above.
| Aspect | ROC Curve | PR Curve |
|---|---|---|
| Axes | TPR vs FPR | Precision vs Recall |
| Random baseline | Diagonal (AUC=0.5) | Horizontal at positive % |
| Perfect classifier | Top-left corner | Top-right corner |
| Imbalanced data | Can be overly optimistic | More informative |
Example on imbalanced data (1% positive): Same model: ROC-AUC=0.95 (looks great!) vs PR-AUC=0.30 (reveals truth).
Interview Tip: ROC misleads for imbalanced data because large TN inflates FPR denominator.
Regression Metrics
Q11: Explain MSE and RMSE.
MSE:
RMSE:
| Property | MSE | RMSE |
|---|---|---|
| Units | Squared | Same as target |
| Outlier sensitivity | Very high | High |
| Interpretability | Harder | Easier |
Why square errors? Makes all positive, penalizes large errors, differentiable everywhere.
Q12: Explain MAE and when to prefer it.
MAE:
| Aspect | MAE | RMSE |
|---|---|---|
| Outlier sensitivity | Robust | Sensitive |
| Error weighting | Equal | Large errors weighted more |
| Interpretation | "Average error" | "Typical error" |
Key Relationship: MAE <= RMSE. If RMSE >> MAE, there are outliers.
Q13: What is R-squared and its limitations?
R-squared:
Proportion of variance explained by the model (0 to 1, can be negative).
Limitations (critical for interviews):
| Limitation | Explanation |
|---|---|
| Always increases with features | Adding noise still increases R-squared |
| Doesn't indicate causation | High R-squared != good causal model |
| Scale-dependent | Can't compare across datasets |
| Can be negative | When worse than mean baseline |
Adjusted R-squared penalizes adding unhelpful features.
Q14: What is MAPE?
MAPE:
| Advantage | Limitation |
|---|---|
| Scale-independent | Division by zero when y=0 |
| Easy to interpret | Asymmetric (penalizes over-predictions more) |
| Comparable across datasets | Biased toward under-predictions |
MAE vs RMSE Deep Dive
Q15: When should you use MAE vs RMSE?
| Use MAE When | Use RMSE When |
|---|---|
| Outliers present | Data is clean |
| All errors matter equally | Large errors especially bad |
| Robust estimate needed | Statistical properties important |
| Business cares about average error | Business cares about worst-case |
Practical Examples:
| Scenario | Better Metric | Reasoning |
|---|---|---|
| House prices | MAE | Luxury homes are outliers |
| Weather forecast | RMSE | Large errors are dangerous |
| Stock returns | MAE | Outliers common |
| Manufacturing | RMSE | Large deviations cause issues |
Q16: How do outliers affect MAE vs RMSE?
Errors: [10, 10, 10, 10, 50] (one outlier)
| Metric | Result | Outlier Contribution |
|---|---|---|
| MAE | 18 | 56% of total |
| RMSE | 24.1 | 86% of total |
Key Insight: RMSE is disproportionately affected by outliers due to squaring.
Ranking Metrics
Q17: What is NDCG?
NDCG (Normalized Discounted Cumulative Gain) measures ranking quality with position discounting.
DCG:
NDCG:
| Property | Value |
|---|---|
| Range | 0 to 1 |
| Perfect ranking | 1.0 |
| Position-aware | Yes (log discount) |
| Graded relevance | Yes |
Q18: What is Mean Average Precision (MAP)?
AP for one query: Average of precision values at positions where relevant items appear.
MAP: Mean of AP across all queries.
Example: Results [1, 0, 1, 0, 1] (1=relevant)
| Position | P@k | Contribution |
|---|---|---|
| 1 | 1.0 | 1.0 |
| 3 | 0.67 | 0.67 |
| 5 | 0.6 | 0.6 |
AP = (1.0 + 0.67 + 0.6) / 3 = 0.76
Q19: What is MRR?
MRR (Mean Reciprocal Rank): Average of 1/rank of first relevant result.
Use when: Only the first relevant result matters (Q&A systems).
Ranking Metrics Comparison:
| Metric | Position Discount | Graded Relevance | Use Case |
|---|---|---|---|
| NDCG | Logarithmic | Yes | General ranking |
| MAP | Linear (via AP) | No (binary) | Document retrieval |
| MRR | Only first | No | First-result focused |
Metrics for Imbalanced Data
Q20: Why is accuracy misleading for imbalanced data?
Fraud detection with 0.1% fraud rate:
| Model | Strategy | Accuracy | Recall |
|---|---|---|---|
| A | Always "not fraud" | 99.9% | 0% |
| B | Actual ML model | 98% | 70% |
Model A has higher accuracy but is useless.
Better Metrics:
- Precision, Recall, F1
- PR-AUC
- Balanced Accuracy
- Cohen's Kappa
Q21: What is Balanced Accuracy?
Gives equal weight to each class regardless of size. Random classifier achieves 0.5.
Q22: What is Cohen's Kappa?
Measures agreement beyond chance.
| Kappa | Agreement Level |
|---|---|
| 0.0 - 0.2 | Slight |
| 0.4 - 0.6 | Moderate |
| 0.8 - 1.0 | Almost perfect |
Micro vs Macro Averaging
Q23: Explain Micro vs Macro averaging.
Macro: Calculate metric per class, then average (equal weight per class).
Micro: Aggregate TP/FP/FN across classes, then calculate (weight by frequency).
| Aspect | Macro | Micro |
|---|---|---|
| Class weighting | Equal per class | By frequency |
| Small class impact | High | Low |
| When to use | All classes equally important | Overall performance |
Example:
| Class | Size | F1 |
|---|---|---|
| A | 1000 | 0.96 |
| B | 100 | 0.75 |
| C | 10 | 0.44 |
- Macro-F1 = 0.72
- Micro-F1 = ~0.94 (dominated by class A)
Q24: When to use each?
Use Macro: All classes equally important, rare classes matter, fairness required.
Use Micro: Overall performance matters, balanced classes, per-instance importance.
Calibration and Brier Score
Q25: What is probability calibration?
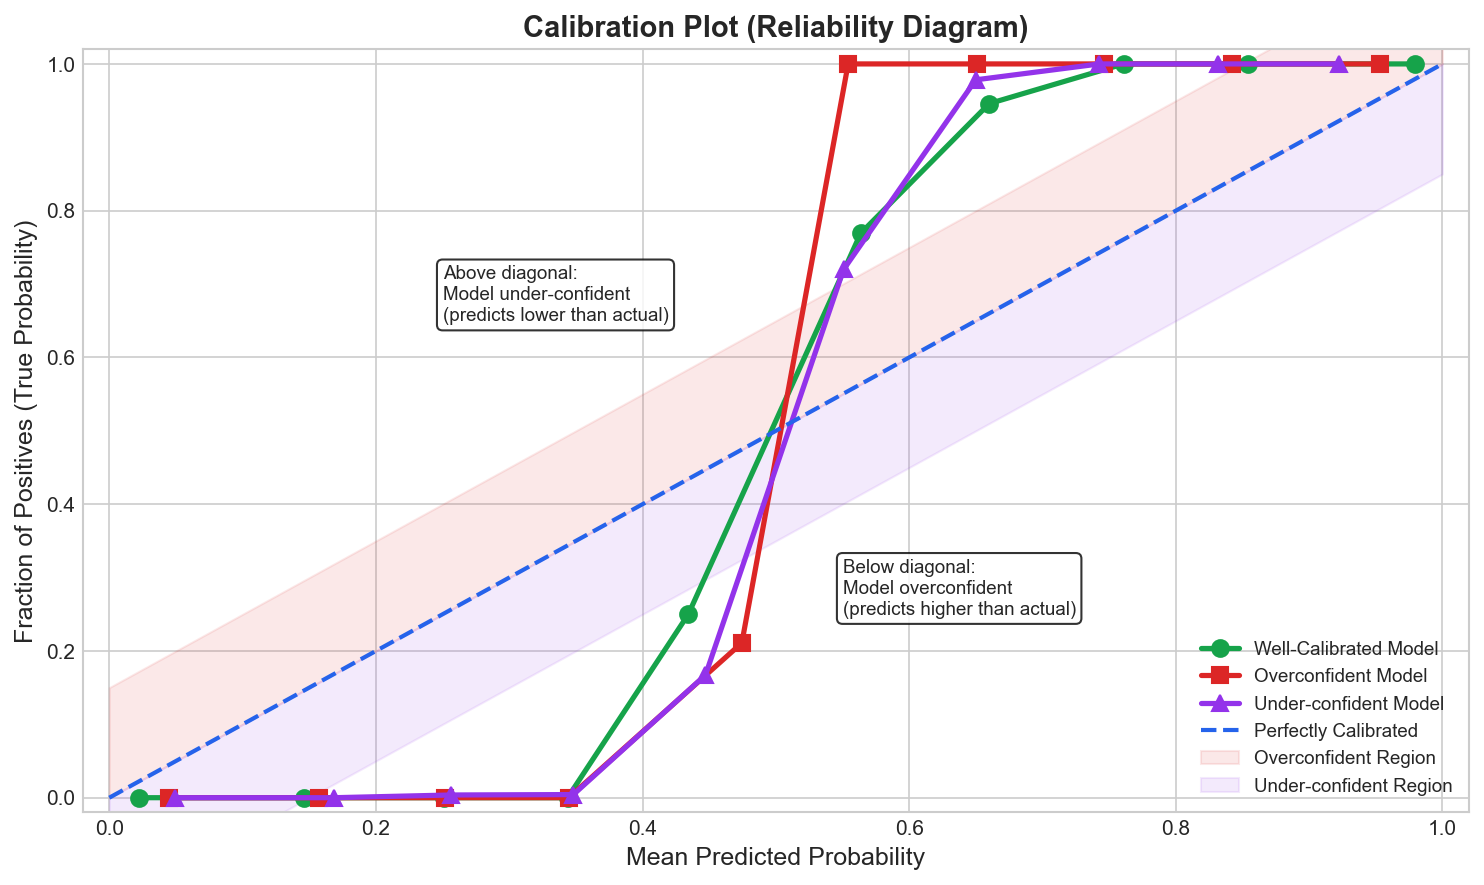
A well-calibrated model's predicted 70% means actual 70% frequency. The reliability diagram above shows how different models can be overconfident, under-confident, or well-calibrated.
Why It Matters: Medical diagnosis (risk must be accurate), insurance pricing, ensemble methods.
Q26: What is the Brier Score?
| Property | Value |
|---|---|
| Range | 0 to 1 (lower is better) |
| Perfect | 0 |
| Random baseline | 0.25 |
vs Log Loss: Brier is bounded (0-1) and penalizes extreme predictions less.
Q27: How do you measure calibration?
Reliability Diagram: Plot predicted vs actual probability (see visualization above). Perfect = diagonal.
Expected Calibration Error (ECE): Weighted average of calibration error per bin.
Calibration Methods: Platt Scaling, Temperature Scaling, Isotonic Regression.
Quick Reference Tables
Classification Metrics
| Metric | Formula | Best For |
|---|---|---|
| Accuracy | (TP+TN)/Total | Balanced classes |
| Precision | TP/(TP+FP) | FP costly |
| Recall | TP/(TP+FN) | FN costly |
| F1 | 2PR/(P+R) | Balance P and R |
| AUC-ROC | Area under ROC | Balanced classes |
| AUC-PR | Area under PR | Imbalanced classes |
Regression Metrics
| Metric | Formula | Outlier Robust |
|---|---|---|
| MSE | mean((y-y_hat)^2) | No |
| RMSE | sqrt(MSE) | No |
| MAE | mean(abs(y-y_hat)) | Yes |
| R-squared | 1 - SS_res/SS_tot | No |
| MAPE | mean(abs((y-y_hat)/y)) | Somewhat |
Ranking Metrics
| Metric | Position Aware | Graded Relevance |
|---|---|---|
| NDCG | Yes (log discount) | Yes |
| MAP | Yes (via AP) | No |
| MRR | Only first | No |
Metric Selection Guide
| Problem | Class Balance | Concern | Recommended |
|---|---|---|---|
| Binary | Balanced | Overall | Accuracy, F1 |
| Binary | Imbalanced | Detect positives | Recall, PR-AUC |
| Binary | Imbalanced | Confident positives | Precision |
| Multi-class | Balanced | Overall | Micro-F1 |
| Multi-class | Imbalanced | All classes | Macro-F1 |
| Regression | Clean | Large errors bad | RMSE |
| Regression | Outliers | Robust | MAE |
Common Interview Follow-ups
"95% accuracy but business says it doesn't work?"
- Check class imbalance
- Wrong metric (they care about recall)
- Poor performance on key segments
- Train-test distribution shift
"Highly imbalanced dataset?"
- Use PR-AUC, F1, balanced accuracy
- Resampling, class weights, threshold tuning
"When does calibration matter?"
- When probabilities drive decisions
- Risk scoring, medical diagnosis
- Combining multiple models
"MAE vs RMSE?"
- Outliers noise? Use MAE
- Outliers signal? Use RMSE
- Ask stakeholder what matters
Formula Cheat Sheet
CLASSIFICATION
Precision   = TP / (TP + FP)
Recall      = TP / (TP + FN)
F1          = 2 * P * R / (P + R)

REGRESSION
MSE   = (1/n) * sum((y - y_hat)^2)
RMSE  = sqrt(MSE)
MAE   = (1/n) * sum(|y - y_hat|)
R^2   = 1 - SS_res / SS_tot

RANKING
DCG@k  = sum(rel_i / log2(i + 1))
NDCG@k = DCG@k / IDCG@k
MRR    = (1/Q) * sum(1 / rank_i)

CALIBRATION
Brier = (1/N) * sum((p - y)^2)Last updated: January 2026