Model Evaluation
Metrics, cross-validation, and bias-variance — the complete evaluation toolkit
Overview
Model evaluation answers: "How well does this model generalize to unseen data?"
| Aspect | Question |
|---|---|
| Metrics | What to measure? |
| Validation | How to estimate generalization? |
| Diagnostics | Why is the model behaving this way? |
Classification Metrics
Confusion Matrix
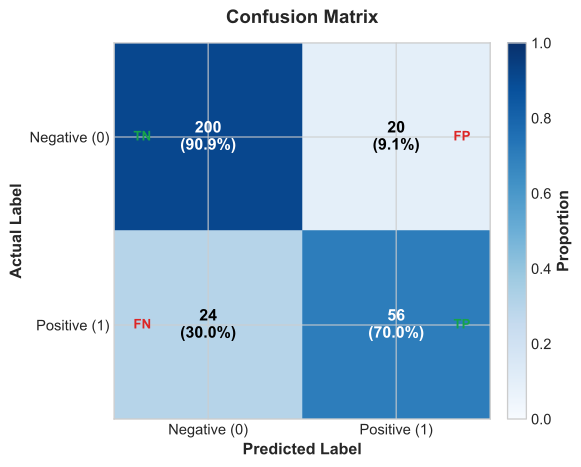
| Predicted Positive | Predicted Negative | |
|---|---|---|
| Actual Positive | TP (True Positive) | FN (False Negative) |
| Actual Negative | FP (False Positive) | TN (True Negative) |
Core Metrics
| Metric | Formula | Use When |
|---|---|---|
| Accuracy | Balanced classes | |
| Precision | FP cost is high (spam filtering) | |
| Recall | FN cost is high (cancer detection) | |
| Specificity | Need to identify negatives | |
| F1 Score | Balance precision & recall |
Precision-Recall Trade-off
- High threshold → High precision, low recall (fewer positives, more confident)
- Low threshold → High recall, low precision (catch all positives, more false alarms)
ROC Curve
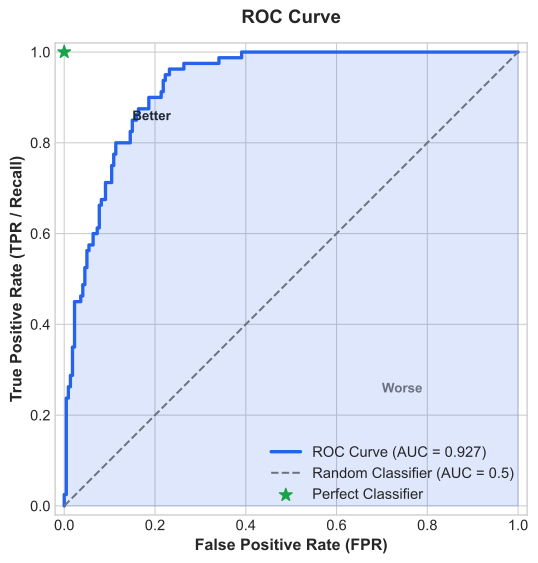
ROC Curve plots True Positive Rate (Recall) vs False Positive Rate:
| AUC Value | Interpretation |
|---|---|
| 0.5 | Random classifier |
| 0.7-0.8 | Acceptable |
| 0.8-0.9 | Good |
| 0.9+ | Excellent |
| 1.0 | Perfect classifier |
Precision-Recall Curve
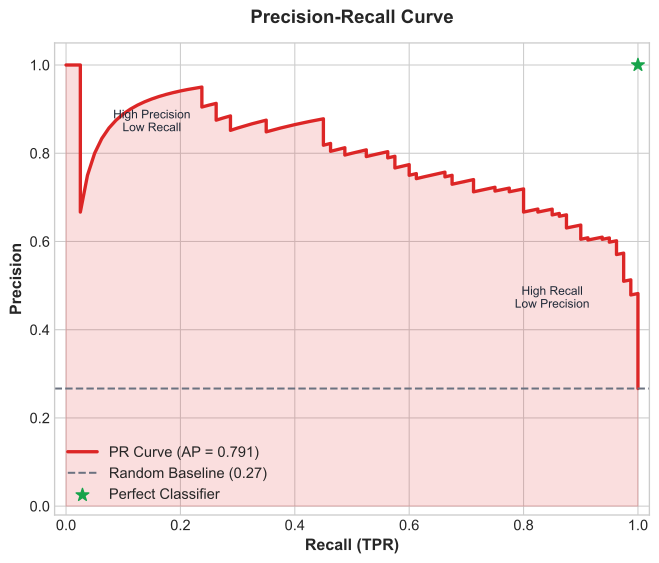
PR Curve is preferred for imbalanced datasets:
- Focuses on positive class performance
- Not affected by large number of true negatives
- Average Precision (AP) summarizes the curve
Metric Selection Guide
| Scenario | Best Metric |
|---|---|
| Balanced classes | Accuracy, F1, ROC-AUC |
| Imbalanced classes | PR-AUC, F1, Recall |
| FP is costly (spam) | Precision |
| FN is costly (fraud) | Recall |
| Ranking quality | ROC-AUC, PR-AUC |
Regression Metrics
| Metric | Formula | Properties |
|---|---|---|
| MSE | Penalizes large errors heavily | |
| RMSE | Same units as target | |
| MAE | Robust to outliers | |
| MAPE | Percentage error | |
| R² | Variance explained (≤ 1; can be negative on test data) |
When to use:
- RMSE: Default choice, penalizes large errors
- MAE: When outliers exist in the data
- MAPE: When relative error matters more
- R²: For interpretability and comparison
Cross-Validation
Why Cross-Validate?
| Single Split | Cross-Validation |
|---|---|
| Wastes data (test set unused for training) | Uses all data for both training and validation |
| High variance estimate | More robust generalization estimate |
| Depends on random split | Averages over multiple splits |
K-Fold Cross-Validation
For
| Fold | Training Data | Validation Data |
|---|---|---|
| 1 | Folds 2,3,4,5 | Fold 1 |
| 2 | Folds 1,3,4,5 | Fold 2 |
| 3 | Folds 1,2,4,5 | Fold 3 |
| 4 | Folds 1,2,3,5 | Fold 4 |
| 5 | Folds 1,2,3,4 | Fold 5 |
CV Variants
| Variant | Use Case |
|---|---|
| K-Fold | Default ( |
| Stratified K-Fold | Imbalanced classification |
| Leave-One-Out | Very small datasets |
| Time Series Split | Temporal data (no future leakage) |
| Group K-Fold | Multiple samples per entity |
Nested Cross-Validation
For unbiased hyperparameter tuning + evaluation:
Outer loop (K₁ folds): Evaluate final performance
Inner loop (K₂ folds): Tune hyperparametersPrevents overfitting to validation set during tuning.
Bias-Variance Trade-off
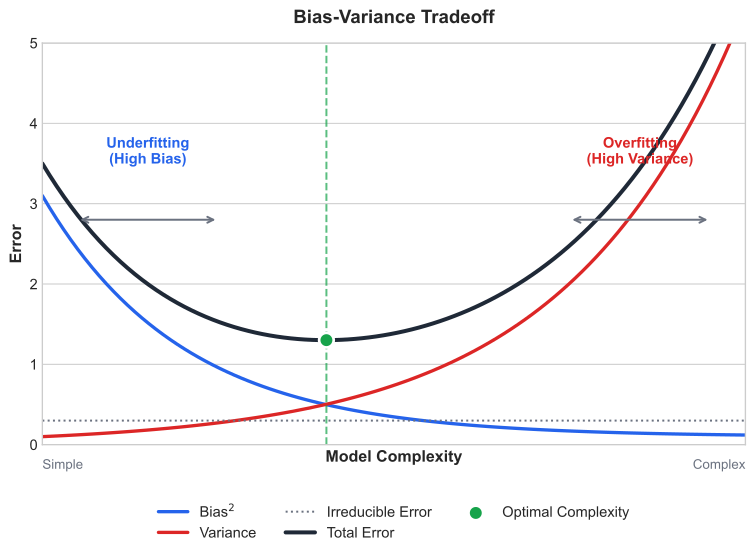
Error Decomposition
| Component | Description |
|---|---|
| Bias | Error from wrong assumptions (underfitting) |
| Variance | Error from sensitivity to training data (overfitting) |
| Irreducible | Noise inherent in the data |
Diagnosis
| Training Error | Validation Error | Diagnosis | Fix |
|---|---|---|---|
| High | High | High Bias (underfit) | More complexity, features |
| Low | High | High Variance (overfit) | Regularization, more data |
| Low | Low | Good Fit | Deploy! |
Remedies
High Bias (Underfitting):
- Add more features
- Use more complex model
- Reduce regularization
- Train longer
High Variance (Overfitting):
- Get more training data
- Reduce features (feature selection)
- Increase regularization
- Use simpler model
- Apply ensemble methods
Learning Curves
Training Size Curve
- High bias: Both curves plateau high together (more data won't help)
- High variance: Large gap between curves (more data helps)
Complexity Curve
- Optimal complexity: Where validation error is minimum
- Underfitting zone: Low complexity, both errors high
- Overfitting zone: High complexity, training low but validation high
Practical Evaluation Pipeline
Step 1: Train/Val/Test Split (60/20/20)
python
from sklearn.model_selection import train_test_split

X_temp, X_test, y_temp, y_test = train_test_split(
    X, y, test_size=0.2, stratify=y, random_state=42
)
X_train, X_val, y_train, y_val = train_test_split(
    X_temp, y_temp, test_size=0.25, stratify=y_temp, random_state=42
)Step 2: Cross-Validate on Training
python
from sklearn.model_selection import cross_val_score

cv_scores = cross_val_score(model, X_train, y_train, cv=5, scoring='f1')
print(f"CV F1: {cv_scores.mean():.3f} (+/- {cv_scores.std():.3f})")Step 3: Tune Hyperparameters
python
from sklearn.model_selection import GridSearchCV

param_grid = {'C': [0.1, 1, 10], 'gamma': [0.01, 0.1, 1]}
grid = GridSearchCV(model, param_grid, cv=5, scoring='f1')
grid.fit(X_train, y_train)Step 4: Final Evaluation (Test Set - Once!)
python
from sklearn.metrics import classification_report

best_model = grid.best_estimator_
y_pred = best_model.predict(X_test)
print(classification_report(y_test, y_pred))Interview Questions
Q1: "95% accuracy but stakeholders say it doesn't work. What's wrong?"
Key points to investigate:
- Class imbalance — If 95% is negative class, predicting "always negative" achieves 95% accuracy
- Wrong metric — Business may care about recall, not accuracy
- Slice performance — Good overall, poor on important segments
- Train-serving skew — Production data differs from training
- Business vs ML metrics — Accuracy doesn't translate to business outcomes
Q2: "How do you choose between precision and recall?"
| Prioritize Precision | Prioritize Recall |
|---|---|
| Spam detection (users hate false positives) | Cancer screening (missing cancer is worse) |
| Drug approval (false efficacy claims dangerous) | Security threats (missing attacks is catastrophic) |
| Fraud alerts (alert fatigue from false alarms) | Search results (better to include irrelevant) |
Process:
- Quantify FP vs FN costs with stakeholders
- Plot PR curve and choose threshold
- If unsure, start with F1 as balanced approach
Q3: "ROC-AUC vs PR-AUC?"
| ROC-AUC | PR-AUC |
|---|---|
| TPR vs FPR | Precision vs Recall |
| Can be misleading with imbalance | Directly measures positive class performance |
| Use when classes balanced | Use when positive class is rare/important |
Q4: "Why cross-validation over single split?"
Problems with single split:
- Test data not used for training (wasteful)
- High variance estimate (depends on split luck)
CV advantages:
- Every sample used for training and validation
- More stable estimate with standard deviation
- Better use of limited data
Quick Reference Card
CLASSIFICATION METRICS
─────────────────────────────────────────────────
Precision: TP/(TP+FP) — "Of predicted positive, how many correct?"
Recall:    TP/(TP+FN) — "Of actual positive, how many found?"
F1:        2·P·R/(P+R) — Harmonic mean
ROC-AUC:   Area under TPR vs FPR — Ranking quality
PR-AUC:    Area under Precision vs Recall — Imbalanced data

REGRESSION METRICS
─────────────────────────────────────────────────
RMSE: √(Σ(y-ŷ)²/n) — Same units, penalizes large errors
MAE:  Σ|y-ŷ|/n     — Robust to outliers
R²:   1 - SS_res/SS_tot — Variance explained (≤ 1; negative if worse than the mean)

BIAS-VARIANCE
─────────────────────────────────────────────────
High bias:     Train high, Val high → More complexity
High variance: Train low, Val high → More regularization

CROSS-VALIDATION
─────────────────────────────────────────────────
K-Fold:     Default (k=5 or 10)
Stratified: Imbalanced classes
Time Split: Temporal data
Nested:     Tune + evaluate

PIPELINE
─────────────────────────────────────────────────
1. Split: Train/Val/Test (60/20/20)
2. CV: Estimate performance on training
3. Tune: GridSearch with CV
4. Evaluate: Final test set (once!)